Today, I’m excited to release version 2.0 of the FI Laboratory!
The FI Laboratory is a web application I developed that contains useful tools to help you on your journey to financial independence and early retirement.
To sign up for a free FI Laboratory account, click here.
If you’ve read the classic book, Your Money or Your Life, you’ll recall that the authors suggest tracking your progress to financial independence on a wall chart.
While tracking your progress is a great idea, I can’t imagine anyone would want to sit down with a ruler and a pencil every month so I decided to create a nice web application with sexy graphs that you can use instead.
Here’s a short video all about it:
FI Tracker
The FI Tracker part of the application allows you to enter your monthly financial data and it automatically charts out your progress to FI and estimates how long it will take you to reach financial independence.
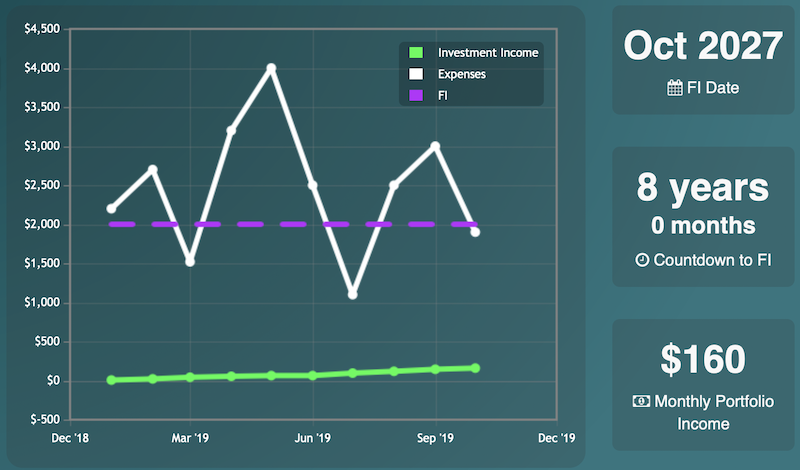
Tracking your progress to FI is beneficial for many reasons. Not only will it help ensure that you stay on target, it should also motivate you to save even more money.
How to Use
After you sign up and log in, you’ll need to enter some of your monthly data.
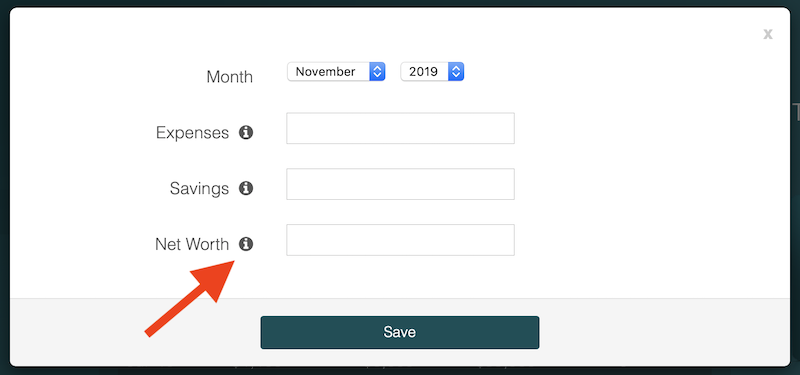
To enter your numbers, click the Numbers link on the sidebar and then click the New Record button.

Each field on the New Record form contains a help icon that you can hover over to view a description of what information you should enter into the field.
Personal Capital
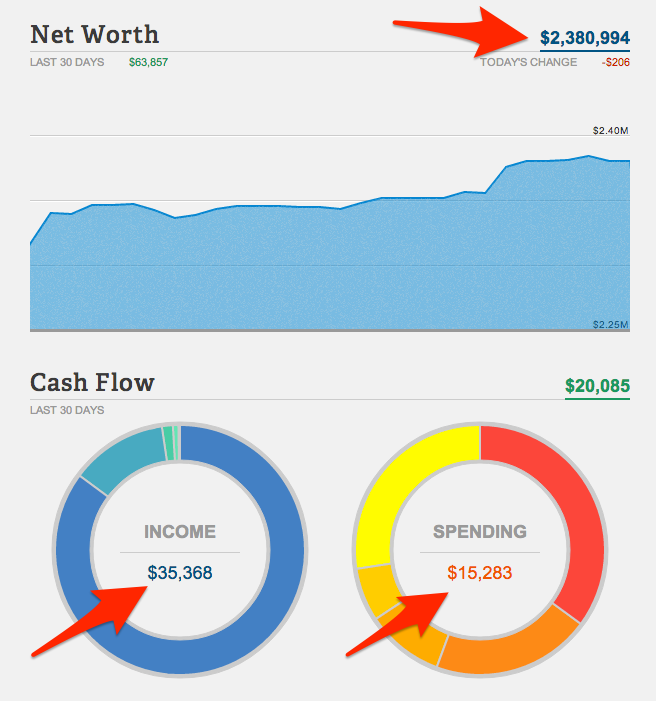
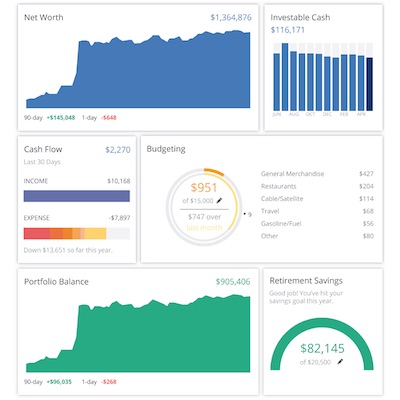
The easiest way to compute your monthly numbers is to sign up for a free Personal Capital account and let their software calculate everything for you (for more information on Personal Capital, check out this post).
Most of the information you need for the FI Laboratory is displayed on the initial Personal Capital screen so you can just log in there once a month to get your numbers instead of calculating everything manually (note: the Income value does not contain retirement account contributions so you’ll need to go to the Transactions page and search for ‘Retirement Contributions’ to get those values).
If you don’t have a Personal Capital account yet, click here to sign up for a free account.
Graph
Once you’ve entered your data, you’ll be able to view the graph and see how much longer you have until FI.

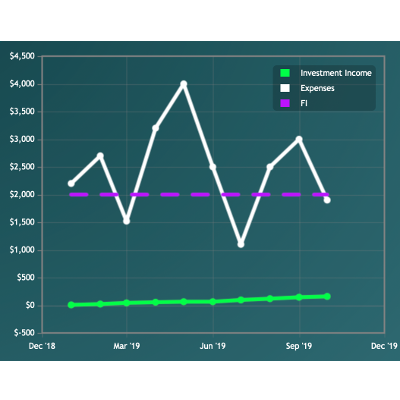
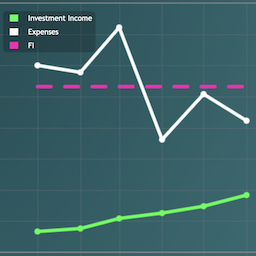
The white line shows your monthly expenses, the light green line shows how much monthly income your assets produce (using the withdrawal rate you set on the Assumptions page), and the dashed purple line shows where the light green line needs to reach to achieve financial independence.
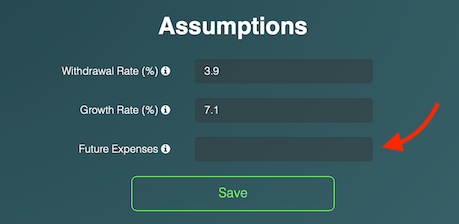
The purple FI line is calculated by averaging your previous 12 months of expenses but if you expect your post-FI expenses to be different than your current expenses, you can set the Future Expenses value on the Assumptions page and the graph will use that number instead.
Additional Instructions
Hopefully the application is easy to use but for more information on how to use the FI Tracker, you can visit the Help page by clicking the question mark icon at the top of the screen (or watch the video at the top of this post).

FIRE Calculators
In addition to the FI Tracker, the application also contains some FIRE calculators I’ve developed over the years.
Time to FI Calculator
The first calculator allows you to quickly compute how many years it will take you to reach FI based on your current net worth, monthly savings rate, and monthly expenses.
Savings Rate FI Calculator
The second calculator shows how many years it takes to go from $0 to financial independence for different savings rates (this calculator was inspired by Mr. Money Mustache’s post on The Shockingly Simple Math Behind Early Retirement).
Triple Value of Income Calculator
The Triple Value of Income calculator was created specifically for the Triple Value of Income article.
Travel Hacking
The final section of the FI Laboratory contains the travel-hacking tools I’ve built to help you earn frequent flyer miles/points as cheaply and efficiently as possible.
My Next Card
The My Next Card page recommends the best credit card offer currently available to you, based on the cards you currently have or have had in the past (see Manage Cards below).
Manage Cards
You can keep track of all your credit cards and application/cancellation dates on the Manage Cards page.

Since past cards influence what cards you are able to get in the future (due to the various rules enforced by the issuers), keeping track of all your cards and applications will help you take advantage of the best card offers.
Credit Card Search Tool
This takes you to the custom credit-card search tool I created specifically for travel hackers.
Travel Card Email Series
This page allows you to sign up to the travel-card email series I created (follow link for more details).
Future Development
I plan to add additional functionality to the FI Laboratory so if you have any ideas for new features, please let me know!
This post was originally published on March 6, 2014 but was updated on February 22, 2022

That’s a great tool! Thank you for putting it out there for others to use.
My pleasure! Glad you like it :)
Nice! I’ve been playing with it for awhile now, and no I haven’t gone blind.
Enjoying it. It says I have 13 years 1 month to FI. Which is about what I’d figured. Now in my defense I have 13 kids, 12 still at home. 4 in college and the rest age 16 down to age 2. We do manage to save 30% of our single income.
I also didn’t include my mortgage-free home that is worth at least $400k in my net worth. Someday we will probably downsize and get a chunk of $$$ out of it but who knows for sure.
The graphs are sexy, not Kate Upton sexy, but nice enough.
You have 13 kids!?! It’s amazing you’ll be able to retire at all :)
I’d love to hear about how you manage to save 30% of a single income with such a big family sometime. Very impressive!
Haha, agreed they are not Kate Upton sexy but as far as graphs go, they are pretty hot!
I originally posted this on your last post and then you did a whole post about the software! Re-posting here for the potential benefit of readers…
Checking out the software and I love it. One question though, in the “numbers” section you have us put in our monthly *savings* yet in the help section example from Personal Capital you recommend getting our monthly *income* to put in this section. Which is it? Do we enter the amount we save each month (investment contributions, regular savings) or the amount we earn through income each month? I’m guessing it is about the savings, not the income, since the savings level is what will generate the investment income that we will need to reach the “crossover” point but I wanted to make sure I’m doing this right.
Hey FloridaStache, I was just about to answer your question on that other post but I’ll answer it here first.
You are right that it’s the savings that you should enter so you’ll have to subtract the “Spending” value from the “Income” value in Personal Capital to get the number to input into the FI Lab.
Thanks for reposting the question here and let me know if there’s anything else I can help clear up!
Ok that makes sense, but I think this is leaving out some important pieces of the equation. If I just look at my net income and expense in Mint (which I happen to use vs. Personal Capital), it doesn’t include my 401(k) contributions as income, nor, I suspect would it include any other pre-tax savings/invesments like an HSA. The reason? These are scraped right off the top before my take-home pay, so it doesn’t appear as “income” in the software. So while these are part of the FI equation in a major way, calculating your savings, etc. using the method you describe would probably lead many to under-estimate their savings rates.
What I did instead was go back and add up all of the actual investment/saving that I did in the first 2 months of 2014:
1. My 401(k) contributions and company match.
2. My Roth and my wife’s IRA contributions.
3. Our monthly contributions to our 2 kids’ 529 plans.
4. The monthly amount that we are setting aside in a “high interest” (LOL) savings account for a potential home purchase in 2015.
I put the total of all of this investing/savings in the “savings” field in the software. I put the actual expenses (as tallied by Mint) in the “expenses” portion. The results look pretty reasonable to me.
You’re right, FloridaStache. I still do everything the hard way (i.e. manually with a custom spreadsheet) so I didn’t notice.
I’ve updated the post to let people know they’ll have to add the retirement contributions to the Personal Capital ‘Income’ value. Luckily, it’s easy to find these numbers by searching for ‘Retirement Contributions’ over the last 30 days so the extra step shouldn’t add too much time.
Thanks a lot for pointing that out!
Retirement contributions wouldn’t show up in Income, but they will show up in net worth, as long as you have those accounts added to Personal Capital (PC). So it should be as easy as:
FI Tracker Expenses = PC Spending
FI Tracker Savings = PC Income – PC Spending
FI Tracker Net Worth = PC Net worth
Right?
Yeah, retirement contributions do show up in net worth but since they don’t appear in income, you’d have to adjust your FI Tracker Savings equation a bit:
FI Tracker Savings = PC Income – PC Spending + Retirement account contributions
Everything else looks correct though!
Yeah, this is a major limitation of Mint and most other financial trackers. What you want to do is make your paycheck transaction a split of a larger transaction that also deposits money into your 401k.
The fundamental problem is that these tools are not a double entry book-keeping system.
If anyone knows of a tool like Mint that supports this kind of thing, please let us know!
What a beautiful tracker – I’ve been using Excel for years to do my own version of the ‘crossover point’, but it was for tracking rather than predicting. I really like the predictive aspect of your calculator, since most of my previous calculations of time to FI have been based on predictions of how much I could save rather than data. You’ve also done a great job of keeping it visually appealing and customizable – thank you for making this available!
Glad you like it, McSaveyPants (awesome name and logo, by the way)!
Agreed, it’s very sexy! I’ve been using a Google Spreadsheet – with graphs – to track my YMOYL “crossover point”. This looks like a great supportive tool for those who prefer a less manual process. Great stuff!
Glad you like it! Thanks for stopping by
Whoops, didn’t realize it wasn’t open to the public, or I wouldn’t have posted the thread on MMM’s forums about it. :)
Either way, nice work, it’s pretty slick.
No, I was really glad you posted it! I had already notified over a thousand people about it so you just expanded my beta test a little bit :)
Here’s some other ideas for related calculators (might be nice to credit him if you use some of the ideas): http://mustachecalc.com/
Whoa, I haven’t seen that site before. Those are some great calculators!
That link is broken already.
I feel it’s important to note at least one thing:
the page on which the password is entered is not encrypted, and none of the other pages are either
This means that passwords and personal financial information are being sent in cleartext in a way possibly viewable by anybody on the internet unless there is custom Javascript for security (probably not a good idea — I’d recommend using SSL instead).
Correct, Greg. I went back and forth on this for a while and I decided it wasn’t worth the extra cost and hassle since I’m not really storing any sensitive information.
I’m still debating whether to implement some sort of third-party authentication so that people can log in securely through Gmail or Facebook but I personally prefer custom username/passwords for sites that I visit so I’m not sure if people would like to use their Google/Facebook accounts to log into the FI Laboratory or not?
As I decide what to do with the site, you can piggyback on Heroku’s SSL in the meantime by accessing the site via the following URL: https://protected-wave-5193.herokuapp.com/.
Personally, I’d rather not used a third party site to log in, and as you said, there isn’t any sensitive information stored here. At any rate, the tool looks great, and I’m looking forward to watching my progress!
Glad to hear you agree, Matt! Thanks for the feedback.
A great tool, thanks!
I am sure you have been busy with getting an initial release out, but would it be possible to provide the ability to upload a CSV file containing monthly spending/saving/net worth?
Mint has a ‘Net Income’ and ‘Net Worth’ trend report, that you can export to CSV. Having the ability to import this into the FI tracker would make it easy to add data.
Thanks again!
Hey Andrew, I’ve added your request to my list of future feature ideas so thanks for the suggestion.
I’m really busy right now finishing up my master’s thesis (see Free Ivy-League Degree) so I probably won’t be making too many big changes any time soon but I’ll be sure to look into a possible CSV import function next time I dive into the code.
How cool! I’ll be sure to play around in the tool a bit.
Let me know what you think after you’ve had a chance to play around with it!
I can’t get in!! I’ve been waiting for something like this a long time.
Hey Bryan, are you still not able to get in? Many other people have been signing up today so everything should be working.
If you’re still having problems, send me an email and I can try to figure out what’s going on.
Awesome-ness!
I love that it tells me months and days! Hey, question; not sure if I understand this correctly.
The time to FI calc, if I enter 400k net, 4500 mo exp, 3435 mo sav, growth 7% and here is where I get confused:
If I enter 3% withdraw rate, it shows 12yrs
If I enter 8% withdraw rate, it shows 8 yrs
wouldn’t the higher withdraw rate require you to save more, so the duration till retirement to be longer for higher withdraw rates and shorter for small withdraw rates?
Thanks in advance,
Steve
Hey Steve, I’ve received a few emails about this so I’m glad you posted this comment.
Lowering your withdrawal rate means you’ll have to build up a bigger balance to pay your expenses so that will increase your time to FI.
For example, if you plan to withdraw 4% from you portfolio to fund your $54,000 worth of annual expenses, you’d need to save up $1,350,000 ($1,350,000 * 4% = $54,000). If you instead decided to only withdraw 3% from your portfolio to fund those $54,000 worth of annual expenses, you’d have to wait until you had $1,800,000 before you could retire ($1,800,000 * 3% = $54,000).
Your portfolio will have a greater likelihood of lasting longer with a lower withdrawal rate but it will take you longer to build up enough to retire.
Make sense?
Ah!
I get it! I made the assumption that lowering my withdraw rate means I lower my income, but my balance stays the same.
so, 1.3M with a 54k withdraw rate is the 4%
1.3M with a 3% withdraw rate is a little over 48k/yr
So, I was making a different assumption where income would reduce along with the withdraw rate.
Thanks!
Steve
This is awesome! I’ll definitely be using this to track my progress. Thanks for this!
Glad you like it!
Just wanted to say that the FI tracker is great! Right now it says I am 13 years, 8 months from FI. When I did my own back of the napkin math this time last year I thought I was anywhere from 15-17 years from FI, so I feel like i’m making progress. Sometimes that progress can be hard to see when your just staring at a spreadsheet.
I’m going to love checking this out on a monthly basis to see how much closer i’m getting to FI. Thanks!
So quick question regarding the net worth. Is it calculating what I should be earning on my entire net worth? I’ve I’ve got 401 and a house included in my net worth, that may or may not be as liquid as I’d like to be able to earn any realized gains.
So would it be better to include only liquid savings into my net worth, as that would reflect a more accurate “investable” number?
Or should the dark green line not be seen as whats actually happening, but more of the ideal scenario, where thats what I “should” be earning every month. Its a bit misleading, but it might just be me. I’ve got my actual passive income amount for each month and its no where near where the dark green line should be according to my graph, especially when the market is doing crappy. I think the answer is that its the optimal view thats being shown, not the actual passive income, but just wanted to make sure.
Thanks
Yes, it calculates what you would earn on your entire net worth based on the withdrawal rate you set on the assumptions page.
I include both my 401(k) and my house equity in my net worth though because I know I could get my 401(k) money if I need it (see this article) and I plan to sell my house prior to FI and will rent for the foreseeable future so that equity will turn into an income-producing asset after FI.
Your situation is likely different though so you should adjust the net worth value accordingly so that the green line accurately reflects what kind of income you can expect after FI.
What an awesome tool. Tweeting about this now!
And not sure if addressed elsewhere, but I would love to be able to copy/paste a record.
Thanks a lot, Jacob!
I added your request to my list of future feature ideas so I’ll try to add that functionality the next time I update the code.
Thanks for stopping by and I look forward to hanging out more in New Orleans this fall!
Thanks! And you as well. I’m possibly trying to get into the house in New Orleans with you and JM and others, we’ll see :)
I actually have the YMOYL wall chart up in my room but this is much easier! New reader here, just stumbled upon your site last week and I’ve read most the posts and listened to all the podcasts – will you be doing anymore podcasts anytime soon? Thanks!
Hey Dom, I’m actually doing two interviews this Sunday that I’m really excited about so look out for a new podcast episode in early April!
Glad you found the site and I look forward to hearing from you again soon
Excellent! I really enjoy podcasts because I can listen while doing house work like mowing the lawn, etc. I’m not sure if you’ve heard of the app ‘stitcher’ (I am not a sponsor or affiliate, I just find it VERY useful and thought I’d share!) but it makes listening to podcasts very easy if you don’t have iTunes.
Keep up the great work, I’ve learned tons in a very short amount of time.
This is great – thank you! I need to have a play around with it a bit more, but so far it looks really helpful!
Glad you like it, Laura! Let me know what you think after you’ve had a chance to play around with it a bit more.
Hi Mad FIentist! Loving the site and the podcasts! Keep the good material coming.
I’ve recently started using your FI Labratory (and like Dom… I too have a YMOYL wall chart hanging proudly on my wall). I do have a question for you regarding the choice to calculate the investment income based on total net worth rather than solely on actual total investments. The reason I am asking is that I have a paid off home that is worth an additional $175000 to my net worth but does not do much towards %7 averaged annual growth I’m striving for. I’m not sure how including my non-investment assets are helping to paint a clear picture my investment income. Love to get your input on this. Thanks so much!
Hey Derek, maybe I should rename that field to something other than net worth? Maybe “Income-Producing Net Worth”? I actually include my home equity in my net worth because I plan to sell my house prior to FI and will rent after FI so that money will produce FI income but I can understand why you wouldn’t include that in your situation.
If I were you, I’d just subtract your house value from your net worth in the FI Laboratory so that it calculates things properly and I’ll think about a better name for that field!
Thanks MF! I assumed as much however thought I might be missing something. I have been using only my actual investments for the calculation of my investment income. In March, I had sold $100K in stock to pay off my home… now I have a nice dip in my investment income! :-)
That is a tricky name to come up with… “Total Investments” maybe??
Yeah, maybe Total Investments would be good. I’ll keep thinking about it and will make a change next time I’m in the code. Thanks!
“Investable Net Worth” ?
That could work too. Decisions, decisions…
i was trying to sign up for the tool today and it seems to be timing out. is there an issue with the server?
Hi Tony,
It looks like my host was having issues yesterday but everything appears to be okay now after I restarted the app. Thanks a lot for letting me know there was a problem and I hope you enjoy using the application after you sign up (let me know what you think about it, if you get the chance)!
Any chance of having the tool support other currencies, like Euro?
Not at the moment but you can still use it as is…just pretend the $ are actually € :)
Hmm, I suppose the formula and calculations are the same regardless of what currency is used yes? I am not the best at math, but I think this is the case, do I get that right?
Small question now I’ve input my numbers: Let’s say I spend 1.5k in a month. But 500 from that is actually going into my investment account. Do I have 1k expenses then? Or 1.5k? I assume the 500 goes into the savings column. And would net worth include the 500 for that month together with all that was already there? If it helps, I am using YNAB to track everything, and I am looking at the income versus expense and net worth reports.
Exactly. The calculations are the same no matter what the currency is so you can simply just pretend the $ is something else.
To answer your other question…yes, you’d have 1k expenses, 500 savings, and the net worth would include the 500 for that month plus whatever else you already have invested.
Thanks so much, it is starting to make sense. One more question, the dark green line on my graph is pretty much a straight line. Is that normal or am I doing something wrong? http://imgur.com/kmWf0JT
That looks okay to me (check out the Guinea Pig’s line…it looks straight as well).
As your investments grow, the power of compounding will become more evident so that line will start arching upwards eventually.
Personal Capital income includes dividends that are automatically re-invested, including 401k. Should that be included in savings?
Yeah, it makes sense to include reinvested dividends because that’s income you are investing.
Love this tool! Thanks for creating it! Looking forward to seeing my FI date draw closer. =)
Would like to know is there anyway to get the password to be reset? Thank you! Haven’t visited in a few months and wanted to update some data points. But looks like I forgot my password. D’oh!
Glad you like it!
I haven’t implemented any way for you to recover a forgotten password yet but I can reset it for you and email you a new one so lookout for an email from me soon.
Thanks! Looking forward to it.
Also noticed something odd, using the Savings Rate Calculator (entered 40% savings rate – not sure if I’m calculating this correctly, 7% growth and 4% withdrawal rate). The results was 19 years to FI. But when I use the Time to FI calculator I get 2 year and 3 months. Then, when I check the FI Tracker, I get 1 year and 10 months. I must be doing something horribly wrong. Can you help? Feel free to reach out via email. Thanks in advance!
I’ll need to see what numbers you are putting in everywhere to figure out what’s going on so I’ll just send you an email.
Replied with attached detailing the numbers inputted. Not sure what I am doing wrong but the calculations appear wrong and inconsistent. For example, when I run the numbers in the Time to FI Calculator I get 2 Years and 2 Months. But for the Savings Rate FI Calculator I get 19 Years. This differs with the FI Tracker results which show 6 months! Can you help? Thanks in advance!
Hey, sorry for the delayed reply; I’ve been traveling around the States for the last few weeks so I’m ridiculously behind replying to comments/emails. I’ll take a look at your email and will get back to you soon.
Thanks! Looking forward to your updates. Oh by the way, repeatedly the “We’re sorry, but something went wrong.” error message when attempting to make a new September entry in the FI Tracker. Am I doing something wrong? Thanks.
Thanks for bringing that error to my attention, sobezen. It turns out the database was maxed out so I had to pay to upgrade to the next tier. Everything should be working now so please try again when you get the chance.
Look out for an email from me in the next day or so (and sorry for the huge delay replying)!
Hi! It looks like the FI Lab tool is broken. Any chance you can take a look under the hood and fix it if needed?
Thank you Mr. B and wishing you a Happy New Year!
Cheers!
I love watching my progress and its very motivating!
I have a question, do you have any future plans on making this into a app? I think it would be awesome to have an app built for this!!
Glad to hear you’ve been enjoying the FI Laboratory!
Since I used a responsive design (i.e. a design that also looks good on mobile devices), I haven’t thought much about creating an app for it but maybe I should reconsider. I’m not a fan of iOS programming though so there’d have to be a big demand to spur me into action!
I’ve been using the FI Laboratory for 11 months now and love it. I do have one suggestion that I would like to see added to the chart. It would be great to see a future projected line on the chart of where you are suppose to be each month based on your original assumptions. That way you know each month if you are ahead or behind of your initial path to FI.
As it was explained to me as a project manager, its hard to know where you are going if you don’t have a map. This path to FI line would be that map.
Thanks.
Glad you’ve been enjoying it and thanks a lot for the suggestion! Do you think the guide line should be the projection of the average of the first 6 months’ worth of numbers or something?
Not exactly sure… but since you already have a entry for future expenses in the assumptions page, maybe just add a “future savings” entry and also have the option for a rolling 12 months savings like you have for expenses.
New reader here found you through MMM. Loving all the posts. It looks like the tool is broken, but could have something to do with my firewall (just says ‘this web page not available’), anyone else having a problem?
Yes the tool is down for me too. Wrote about it in a post above yours.
It seems I forgot my password, and I just accidentally logged out. Is there a chance it can be reset by you?
Hey, I’ve just started playing with this tool and it’s really great! I discovered it just shortly after making my own custom spreadsheet which makes a similar graph, but this is a lot simpler and it’s nice to at least get some validation that what I was graphing on my own wasn’t totally nonsensical. Thanks for putting this and so many other useful resources out there!
I have some questions about what numbers you feel should be used to yield the best results: should I be including my home equity in my net worth? And, does it make more sense to count the principal part of my mortgage payments as “savings”, or just to count the whole thing as an expense?
I usually prefer to do my calculations using home equity as part of my net worth and my principal payments as part of my savings rate, but sometimes I wonder if I’m fooling myself as to their impact on how soon I can retire. It makes a huge difference in the length of time until FI… but has me FI at a time significantly before I can realistically pay off the house (because a large majority of my savings are in retirement accounts).
I would definitely include home equity in your net worth and include mortgage principal payments as savings!
I’m curious as to why you say that (in the context of the FI Laboratory’s calculations). Your home equity is not generating investment income for you, right?
I’ve actually been taking the opposite approach, where I don’t include home equity in my net worth and I also categorize my mortgage principal payment as an expense. My thought process is that it would take a certain amount of *invested* savings from which I could draw down to support me in financial independence, and, since I’m currently obligated to pay mortgage principal each month, my savings would have to cover that cash outflow (again, in my current situation).
Now, if I sold my house and invested the proceeds, then my net worth would suddenly be higher in the FI Laboratory, and the timeline would adjust accordingly. Also, if I paid off my mortgage (and stayed in the house), then from that point forward I would no longer have that monthly mortgage principal expense and that would be reflected again in the timeline (because I have less expenses each month).
Is my thinking off? Thanks for the great work BTW!
It would be really awesome if you could add an input for passive flows of income expected during retirement. For instance, we have passive income from rental properties and family partnerships and expect that to continue into perpetuity.
Great idea! I’ve added that to my list of future feature ideas so I’ll implement that next time I make updates to the FI Lab. Thanks!
Hi! I’ve been using this great tool for quite a while now, and I have a question about how the time to FI is calculated. My wife and I are both teachers, and we get paid the same every month, except in June we both get 3 months worth of pay all at once, and then we don’t get paid again until the end of September. Because of this huge inconsistency in savings rate from month to month, our time to FI number on the graph is changing drastically depending on what time of year it is. How is this number calculated? Is it averaging the numbers from every month in the history of the graph, or is it averaging a certain number of the most recent months? If I knew which numbers are being used, it would make it easier for me to figure out a more accurate projection.
Thanks!
Hi – thanks for this great tool. I’m wondering if there are any adaptations to calculations that need to be made if some of the accounts we have linked to Personal Capital are joint? For example, if you have a joint savings or spending account with a spouse.
Still love this tool! I have a small feature request. It would be really nice if there was a “notes” section where I could record manual changes I make so I remember in the future. For example, like a previous reader or two, I pull out my home’s equity from the calculation since I intend to keep it (at least for the next 5 years or so). I also remove my cabin’s expenses from the monthly expense tally (but keep the equity since we’ll be selling it). It would be really nice to have a reminder of these changes so I don’t have to try and remember it each month. Thank you!
Hi! Thanks for creating the web app.
A huge chunk of our retirement will be rental income. Unfortunately, you don’t have a space for that in the app. How should I account for that. One hack would be to add
(net rental income)/(SWR)
to my assets.
Is that what you recommend?
Thnx
Thanks for the app is great :)
Hello,
Have you thought about how to integrate rental investments and income into the calculator?
Thanks!
My employer switched providers and personal capital cannot link to the new 401k. I am so upset about this. Personal capital is an important tool. I cannot even enter the info in manually as some of my funds are institutional and not public. Such a bummer. So how do you feel about mint with your tool? Also i just realized all this time when i did have personal capital i was not adding the retirement contribution to income. hmm
Hope it’s just me! I can’t seem to open the FI Lab. I get the message “Application Error: An error occurred in the application and your page could not be served. If you are the application owner, check your logs for details.” It’s worked for me in the past but not tonight when I was trying to access it.
Newbie here. I am learning so much and i appreciate your contributions to the community!
I have question that might seem obvious to some but im still trying to wrap my mind around. I assume that all the money in my Net Worth Cell is growing at 7.1%. Should I remove items from my net worth (such as cash) that is not being invested? Thanks!!!
How does this differ from your FI Excel spreadsheet? Is there a reason to choose one over the other, or to use both? Thanks!
I have a question: Mint and PC lump my IRA contributions in with “Spending” when looking at cash and credit transactions, but they also show up as “Deposits” under investment transactions. I am assuming I should exclude them from my “Spending” calculations since that is not really what they are and it would artificially inflate my spending, correct? Thanks!
Hi, I’m not based in the US and so can’t get access to Personal Capital (the tool doesn’t recognise my mobile number). I’m trying to figure out how to interpret what Savings means in your graph. Is it Passive Income minus Expenses? Or Total Income minus Expenses? Where Total Income = Passive Income + Active Income
Thanks
I’ve been using it as total income minus expenses. I believe the savings is only used in the calculation of your “FI date”, and I think the tool assumes that all savings are invested and return the “growth rate” you set in the “assumptions” section.
Thanks for this valuable tool! After tracking on here for the past year, I realized that there are two categories of savings (and pieces of our net worth) that might need to be taken out. One is our kids’ 529 accounts (both our contributions to it counting as “savings” and the balance counting toward net worth). The other is our home equity. We are working toward a 50% savings rate, and this definitely includes principal payments on our mortgage and the amount we contribute to our kids’ college funds. But if our kids use their college funds, those will be spent…so really, should we be thinking of their college funds as sinking funds? Home equity is a little muddier…while we don’t necessarily intend to sell our home after FI, we do intend to have it paid off as soon as possible, so our expenses will go down significantly once we reach a zero balance. Thanks in advance for your thoughts on this!
Do you offer a service where you or someone from your team can help me put the spreadsheet together? I have taken it as far as I can go, but it’s incomplete.
Love the Tracker, but it won’t update for me today! I’ve been away for a while and wanted to update my graph, but I get “Sorry, something went wrong” messages if I try to change assumptions or add new data. I’m glad you’re busy doing other cool things, but I do miss this one.
Great tool! Have you considered giving users the ability to link bank accounts so these numbers automatically calculate every month?
Great update!!
Question about the SWR tool – why does it bottom out at 3.5%? Thanks!!
Brandon,
Been using the Lab since Dec 2014. Thank you so much for providing it. Two suggestions for your new credit card section: adding more cards (for example nothing from American Airlines on the list), and adding another user such as a spouse since a lot of us take turns with a particular card.
Also, on Firefox the “add a card” button sometimes turns the browser window solid white. I had to use the back button a few times to complete the action. It doesn’t seem to occur on Chrome or Edge.
Has anyone been able to find out how to pay your mortgage with a credit card so you earn the miles?
Thanks!
Fi Tracker keeps telling me my expenses are not a number, when they are. Tried this on more that one computer and it still tells me that. Bummer.
I’m 54 years old and my net worth is less than $ 300,000. I’m just finding out about the communities of FI. The more I listen and read these podcasts and blogs the more I feel how much I am not intentional with my finances and disappointingly regrettable of my whole working career! What do I do? I’m not a saver naturally, obviously! I feel completely lost and hopeless!
Hello.
I’ve been using this application for many years now and it is really helpful. I have a question. Today I was playing around with the assumptions and noticed something. When I decreased the withdrawal rate from 4% to 3.5% my time to FI increased by a few months. When I increased the withdrawal rate from 4% to 7% my time to FI decreased to now. Is this accurate? I feel like the opposite would be true. I’m sure it’s operator error on my part or I am misunderstanding something. I did not know how to contact you all other than this comment section. Any explanation to enhance my understanding would be helpful. Thank you again for this amazing and very useful tool.
Is there a downloadable version? I am uncomfortable entering personal financial information like this into an online application.