This page explains how to use my personal financial independence spreadsheet.
If you haven’t already downloaded the spreadsheet, click here to download now!
Net Worth Tab
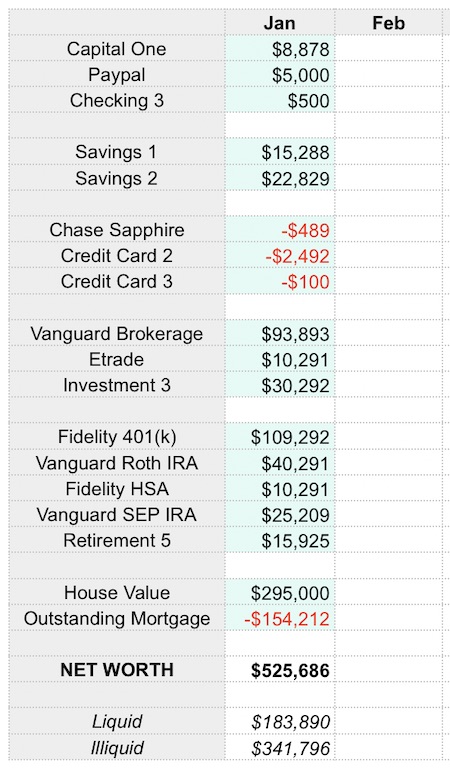
The first tab in the spreadsheet is where you record your monthly account balances and calculate your net worth.
Luckily, this step is easy because Personal Capital* aggregates all of your accounts for you.
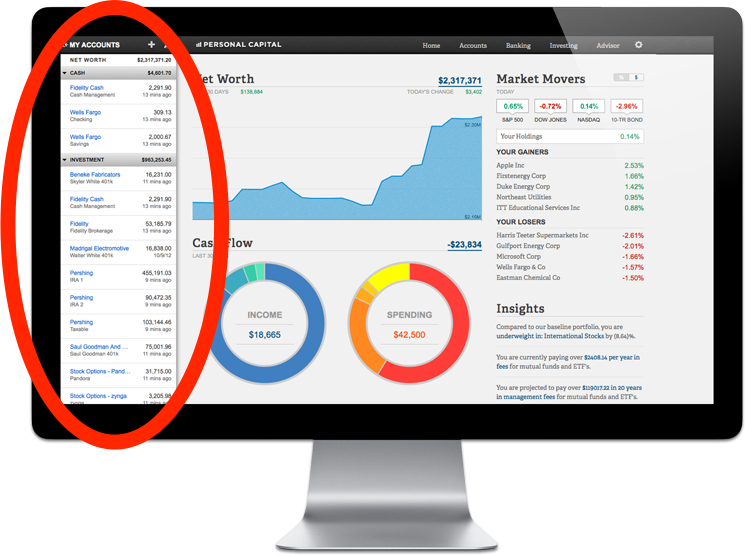
If you don’t have a Personal Capital account, you can sign up for free here. It’s the best tool I’ve found for managing my portfolio so I definitely recommend it.
To fill out this page of the spreadsheet, copy the previous month’s column, change the column header to the current month, and then populate the fields that have a green background with the latest data from Personal Capital.
Note: You should only update the cells that have a light green background because all other fields have formulas and will update automatically.
In addition to computing your net worth, this tab also shows how much of your money is liquid (i.e. you could access immediately) vs. illiquid (i.e. harder to get at, like money in your 401(k)).
Investments Tab
The Investments tab uses the values on the Net Worth tab to provide a picture of where your money is located and what you’re invested in.
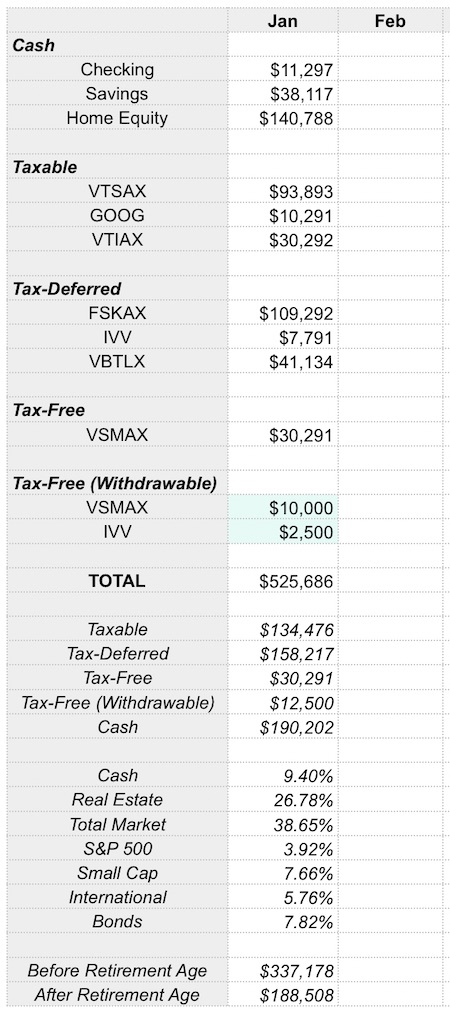
The Investments tab computes the totals of each type of investment account (e.g. taxable, tax-deferred, etc.) so you can get an idea of how your money will be taxed when you eventually withdraw it.
This sheet is where you can keep track of how much of your HSA you can withdraw early (see this post for how I use my HSA as an investment account) and how much money you’ve contributed to your Roth IRA (which can also be withdrawn at any time). These are the only two values that you need to update on this tab because everything else is calculated automatically from previously-entered data.
The Investments tab also automatically computes your asset allocation so you can use this sheet for portfolio rebalancing.
Finally, the Investments tab computes the total amount of money available before and after standard retirement age (remember though…if you plan to retire early and want to access your tax-deferred money sooner, there are ways to do that).
Averages Tab
The Averages tab is where you record your monthly spending.
This step is really important because you can’t determine if you’re financially independent without knowing how much you spend every year.
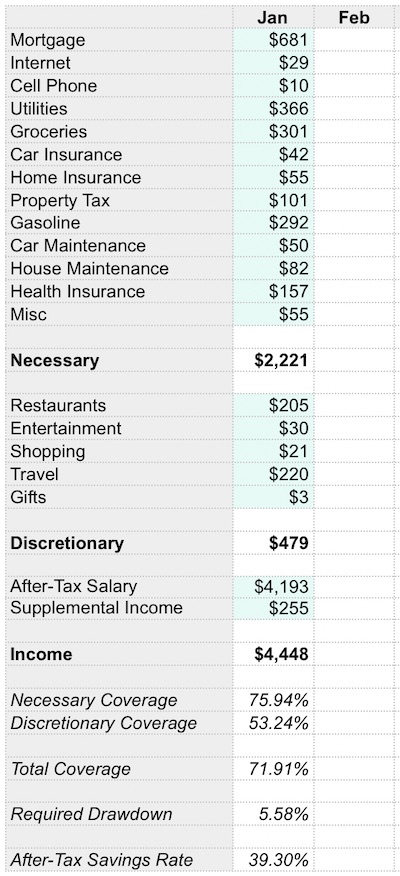
To make this step easier, I use Mint.com to categorize my monthly expenses.
Personal Capital can do the same thing but since I started using Mint before Personal Capital came out, I’ve just continued using it for this purpose.
There are a few interesting calculations that occur on this tab that are worth explaining…
- Necessary Coverage – This row shows what percentage of your essential monthly expenses are covered by your portfolio, using the withdrawal rate set on the FI tab.
- Discretionary Coverage – This row shows what percentage of your discretionary expenses are covered by your supplemental income.
- Total Coverage – This row shows what percentage of your total monthly expenses are covered by your portfolio and your supplementary income. When this column is consistently over 100%, you’re financially independent!
- Required Drawdown – This row shows what percentage of your portfolio you’d need to withdraw every year to sustain your monthly spending (based on the current month’s spending). Once this value is consistently lower than your safe withdrawal rate, you’re financially independent!
- After-Tax Savings Rate – This row computes your after-tax savings rate. Keep increasing this value and you’ll be FI in no time :)
FI Tab
The FI tab is the final tab in the spreadsheet and also the most important.
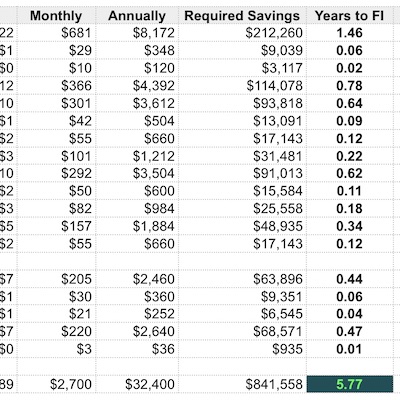
Here, your monthly expenses are annualized and your “Time to FI” number is calculated based on those expenses.
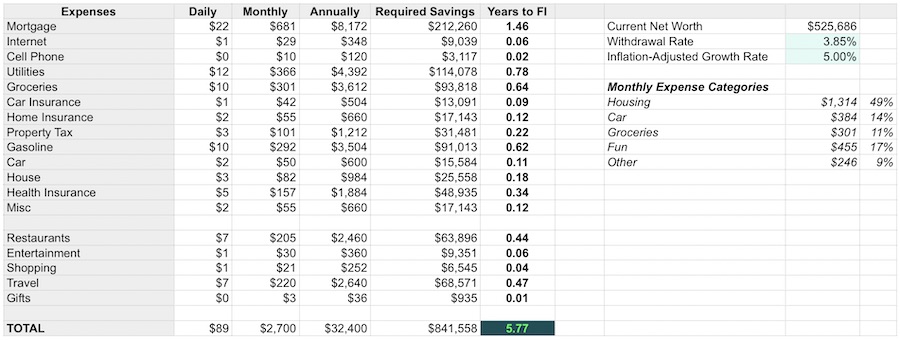
On this tab, you have to update the Withdrawal Rate and Growth Rate assumptions once but then you’ll never have to update anything again.
The FI tab is great for motivating you to lower your expenses because when you see that it will take an extra 1.2 years of work to permanently fund your expensive cable TV package, for example, you’ll probably be more likely to decrease that expense or eliminate it completely.
This tab also shows you how much you’re spending on all the major spending categories (e.g. housing, car, etc.), which is really useful when making big lifestyle decisions.
For example, if you see that your car costs you over $500 per month but you don’t use it that much, it may be worth calculating how much it would cost to take Ubers/Lyfts instead. Or, you could compare your total housing expenses to how much it could cost to travel and stay in Airbnbs full time and it may make more sense (and be more fun) to become a nomad instead.
Finally (and most importantly), this tab computes how long it will take you to reach FI!
Increase your income and/or lower your expenses to decrease your “Years to FI” number and walk away from your job even sooner!
Video Walkthrough
For even more information about the spreadsheet, here’s a short video I made about it:
Questions/Suggestions
I hope you get as much use out of this spreadsheet as I have.
If you run into any issues with formulas or if you don’t have any software to open the .xls file, just upload the file to Google Sheets and use it there.
FI Laboratory
And if you want to easily chart out your progress to financial independence on a pretty graph, check out the FI Laboratory software I developed!
* If you sign up for a free Personal Capital account using the links provided in the post, this site may earn a commission. Thank you for your support!

